Abstract: This project addresses the challenge of monitoring liveness of sleeping subjects, via breathing pattern monitoring at distance and under “night-light” conditions. I investigate video-based approach to estimate the breathing rate, based on chest or back movements.
The ultimate application is to detect abnormalities in breathing, and, therefore, detect health emergencies in environments such as homeless shelters. A body pose estimation algorithm (OpenPose) and the Lucas-Kanade optical flow method are combined in order to automatically detect the region of interest (ROI) and create a grid with multiple points to be tracked over the frames.
The movement of the grid points are then translated into the respiratory events frequency. To conduct the experiments, I used a dataset with 28 near-infrared videos and collected another 11 videos with people uncovered and partially covered with blankets, evaluating different positions. I compared the breathing rate baseline with the breathing rate estimated by our approach method, and obtained the coefficient of determination of 0.925 in linear correlation analysis and accuracy of 99.70%. For the created dataset, I achieved the coefficient of determination of 0.873 and accuracy of 88.95%. The results suggest that it is feasible to develop an application for non-contact, video-based, automatic detection of the ROI and monitoring of respiratory patterns even without visually clear body or face.
Dataset : I used the Sleep dataset. This is a dual-mode sleep video database referred to in the paper: Hu M, Zhai G, Li D, et al. Combination of near-infrared and thermal imaging techniques for the remote and simultaneous measurements of breathing and heart rates under sleep situation.
Key Takeaways:
- Video-based breathing rate measurement.
- Pose estimation algorithm with OpenPose.
- Motion detection/tracking with Lucas-Kanade optical flow
- Smoothing signal with Butterworth Filter
- Linear Correlation Analysis and Bland-Altman plot.
Introduction
For measuring the breathing rate (BR) of sleeping subjects I am using videos captured by a near-infrared camera usually applied in surveillance systems. Breathing rate is often the most sensitive way to diagnose acute respiratory dysfunction or even situations where the person is feeling sick, having a stroke or seizures. The COVID-19 virus that causes respiratory failure has also been a concern for the homeless population.
Particularly, I am interested in patterns that can indicate body movements, positions and variation in BR at various sleep stages of the subjects. These patterns, along with their derivatives, represent source of information for further decision making regarding risks in the context of public health and safety in shelters.
ROI detection
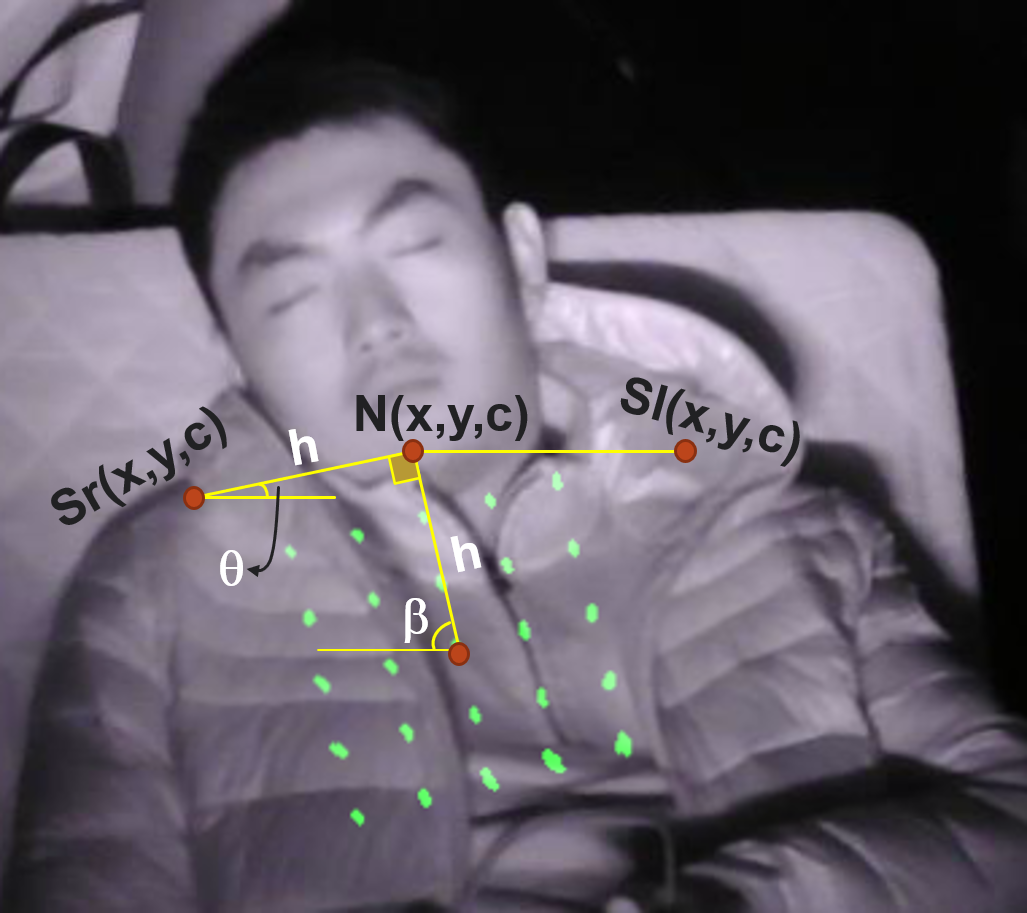
I used the OpenPose algorithm to detect chest/back on the sleeping subjects. OpenPose can, in real-time, detect the human body, hands, face and foot key-points (in total 135 key-points) in one or more subjects.
Each body point is composed of the coordinates x; y and the confidence c, which represents how confident the algorithm is to that point belongs to a particular body part.
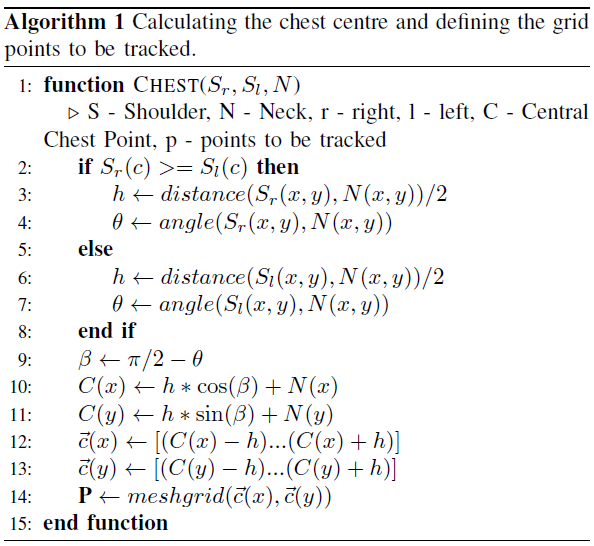
Among 25 body key-points I selected those ones belonging to the shoulders and neck. Next, using the three coordinates Sr(x; y; c), Sl(x; y; c) and N(x; y; c), I calculate the central point on the chest/back as a reference, and create a mesh of other points around it. This calculation is shown in Algorithm 1 and visually presented on the figure below.
Tracking Points
Once I have the points \(\vec{P}\) calculated by Algorithm 1, they are tracked using the Lucas-Kanade Optical Flow (LK) method. It assumes that the flow is substantially constant in a local neighborhood (same frame) of the pixel under consideration. With the LK algorithm and the OpenCV library, a given pixel position in the next frame is defined based on a small window containing the most probable new position of the pixel. The parameter used for window size is winSize = (50, 50). Given a hypothetical point with intensity I(x; y; t), where x; y are the spatial coordinates and t is the frame index in time, the next frame, at time (t + dt), has the coordinates moved by (dx, dy). The intensity of the new point shall be the same as for the original one:
\[I(x+dx, y+dy, t+dt) = I(x,y,t)\]Using the Taylor series, the LK task is to find the shift values (dx, dy) presented in previous Equation that minimizes the sum-squared error of the brightness constancy for each pixel in the defined window. Given certain pixel values from a frame, the LK gives back the referent values for the next frame.
Frequency De-noising
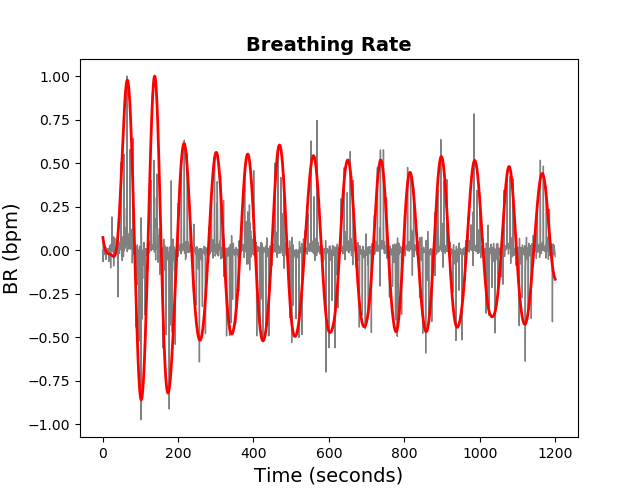
The points \(vec{P}\) tracked using Algorithm 1 and the LK method are recorded in time using the rate of 30 frames/sec. There are small oscillations that are not related to BR, and are considered “noise”. To filter those unwanted frequencies I used the well-known 3rd - order low-pass Butterworth filter, with cut-off frequency of flow = 0.05 Hz. The order of the filter is the degree of the approximating polynomial. The higher the order, the more the filter approaches the “ideal”. However, impulse response and latency also become longer. Figure below presents the comparison between the unfiltered (gray) and the filtered (red) BR signals.
Experiment on Breathing Rate Estimation
Figure below illustrates the overview of the proposed approach that can detect abnormalities in the subject’s respiration.
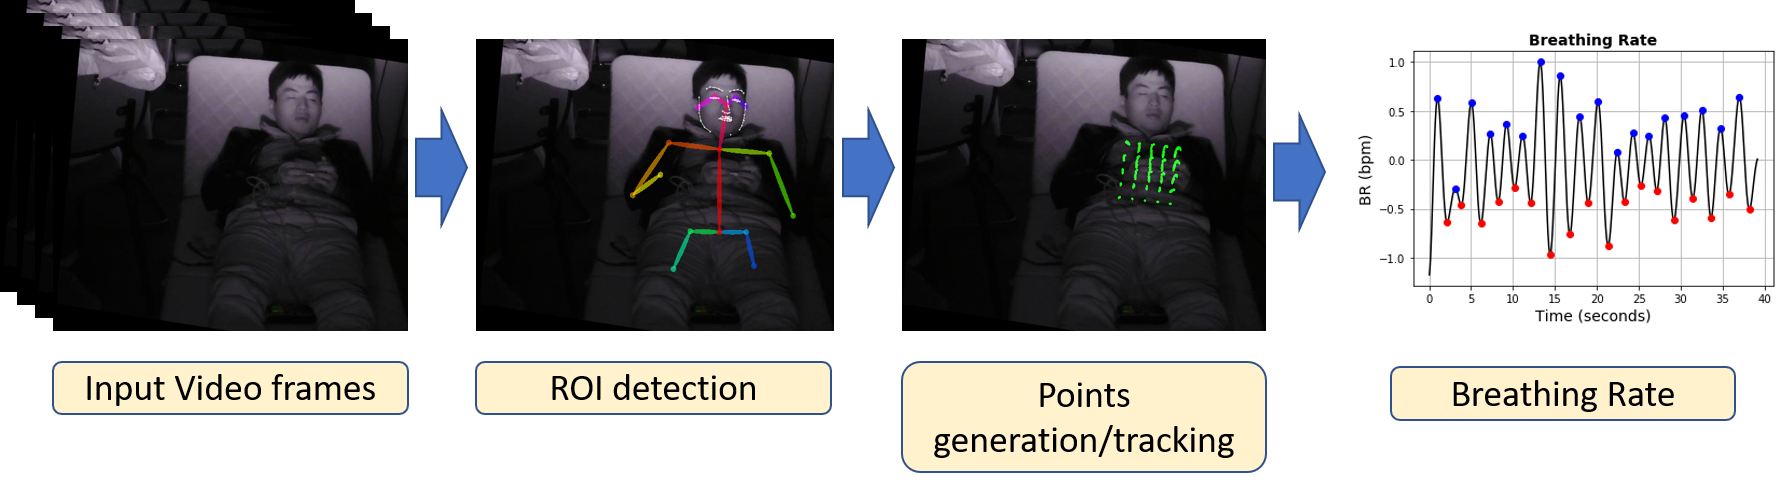
The inputs are the video frames of the subject. OpenPose and the Algorithm 1 were used for detecting the ROI in the first frame, either on the subject’s chest or back. A mesh of 25 (5x5) points was created and then tracked with the Lucas-Kanade optical flow method over the frames. For each frame, those 25 points are taken, corresponding to the same moving pixels. The Frobenius matrix norm (the sum of the absolute squares of its elements) was calculated for the 5x5 matrix represented by a vector of size 25:
\[\displaystyle\|A\|_{\text{F}}={\sqrt{\sum_{i=1}^{m}\sum_{j=1}^{n}|a_{ij}|^{2}}}\]This value changes according to the respiratory movement. Any noise caused by the image quality or brightness is filtered using the Butterworth filter. If there is a movement across the ROI that disturbs the signal, it is identified for each frame as follows. First, I define as reference the central point of the 25 available points. I consider each point value p as its distance from the rectangle center in the grid of uniformly distributed points. I then calculate the possible outliers among each individual point p, and \(\vec{P}\) is the vector of all points. The outlier is a data point that lies outside the overall pattern. It can be identified as any point which falls outside the range of the 1.5-times Interquartile ranges (IQRs), below the first quartile Q1 or above the third quartile Q3:
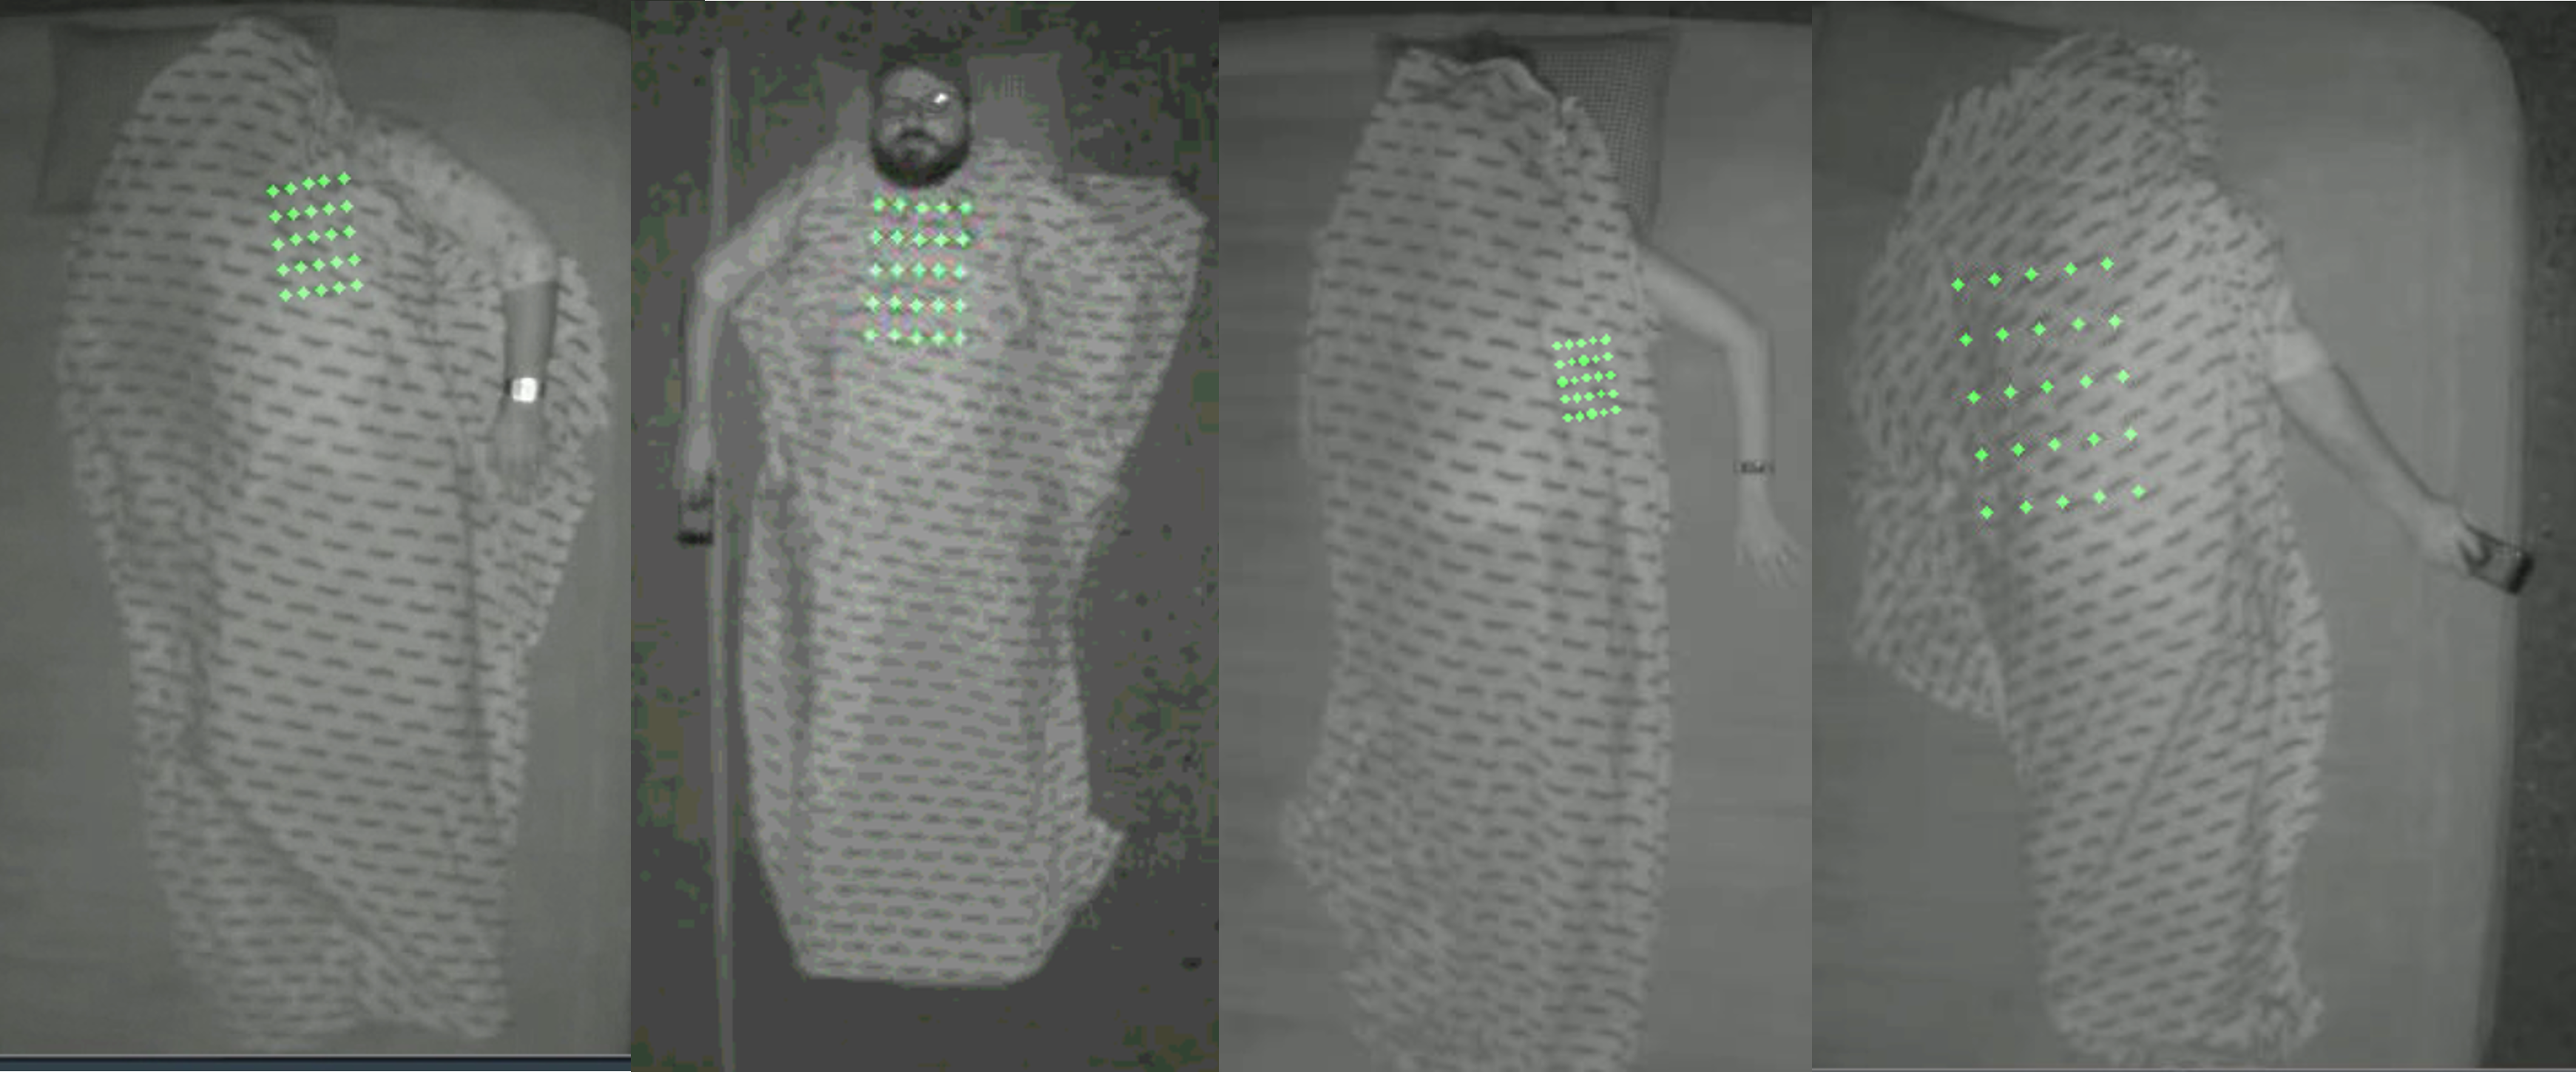
\[outlier_{inferior} = p < Q1(\vec{p}) - 1.5 * IQR(\vec{p})\] \[outlier_{superior} = p > Q3(\vec{p}) + 1.5 * IQR(\vec{p})\]To validate the proposed approach in terms of distance to the subject and body occlusion, e.g. with blankets, I created a second dataset with 11 videos in the near-IR spectrum using the near-IR camera Avigilon H4 HD Dome positioned on the ceiling to cover a complete view of the monitored subject. The video length was 1 minute, with subjects located at a distance of 2.87 to 3 meters from the camera. In these videos, the subjects have additional positions, such as face down and the body partially covered by a blanket. A printed blanket was also chosen to have a better view of the points to be tracked. Some samples from the dataset are presented in Fig below.
Evaluation of the Proposed Method
To test the performance of the proposed approach, I have used two statistical analysis methods: Linear Correlation Analysis and Bland-Altman plot. Additionally, to compare the results for both available datasets, I calculate the Accuracy (Acc), the Mean Absolute Error (MAE) of breaths per minute and the Standard Error (SE), as described below.
Given the average values of the breathing rate, the percentage accuracy is calculated as:
\[Acc = 100 - 100*\frac{\mid MBR_{avg} - EBR_{avg}\mid}{MBR_{avg}},\]where MBRavg and EBRavg are the actual measured average breathing rate, and the estimated average breathing rate calculated by the proposed method, respectively.
To compare the breathing rate measured by instruments and calculated by the proposed method, I use the Mean Absolute Error (MAE) of breaths per minute. It is a measure of error between the paired observations:
\[MAE = \frac{1}{n} * \sum_{i=1}^{n} \left| EBR(i) - MBR(i) \right|\]where n is the number of samples, EBR(i) and MBR(i) are an estimated breathing rate per minute and a measured breathing rate per minute for each subject, respectively. The Standard Error (SE) is then calculated as: \(SE = \frac{SD}{\sqrt{n}},\)
where SD is the standard deviation of the absolute difference between estimation and the reference data (EBR - MBR).
Results and Discussion
To validate the proposed approach, I used Dataset #1, which contains 28 videos in NIR and the Dataset #2 that was composed for this study and contains 11 videos in the NIR spectrum. This second dataset was used essentially to validate whether the proposed approach would work for the subjects covered by a blanket or lying face down.
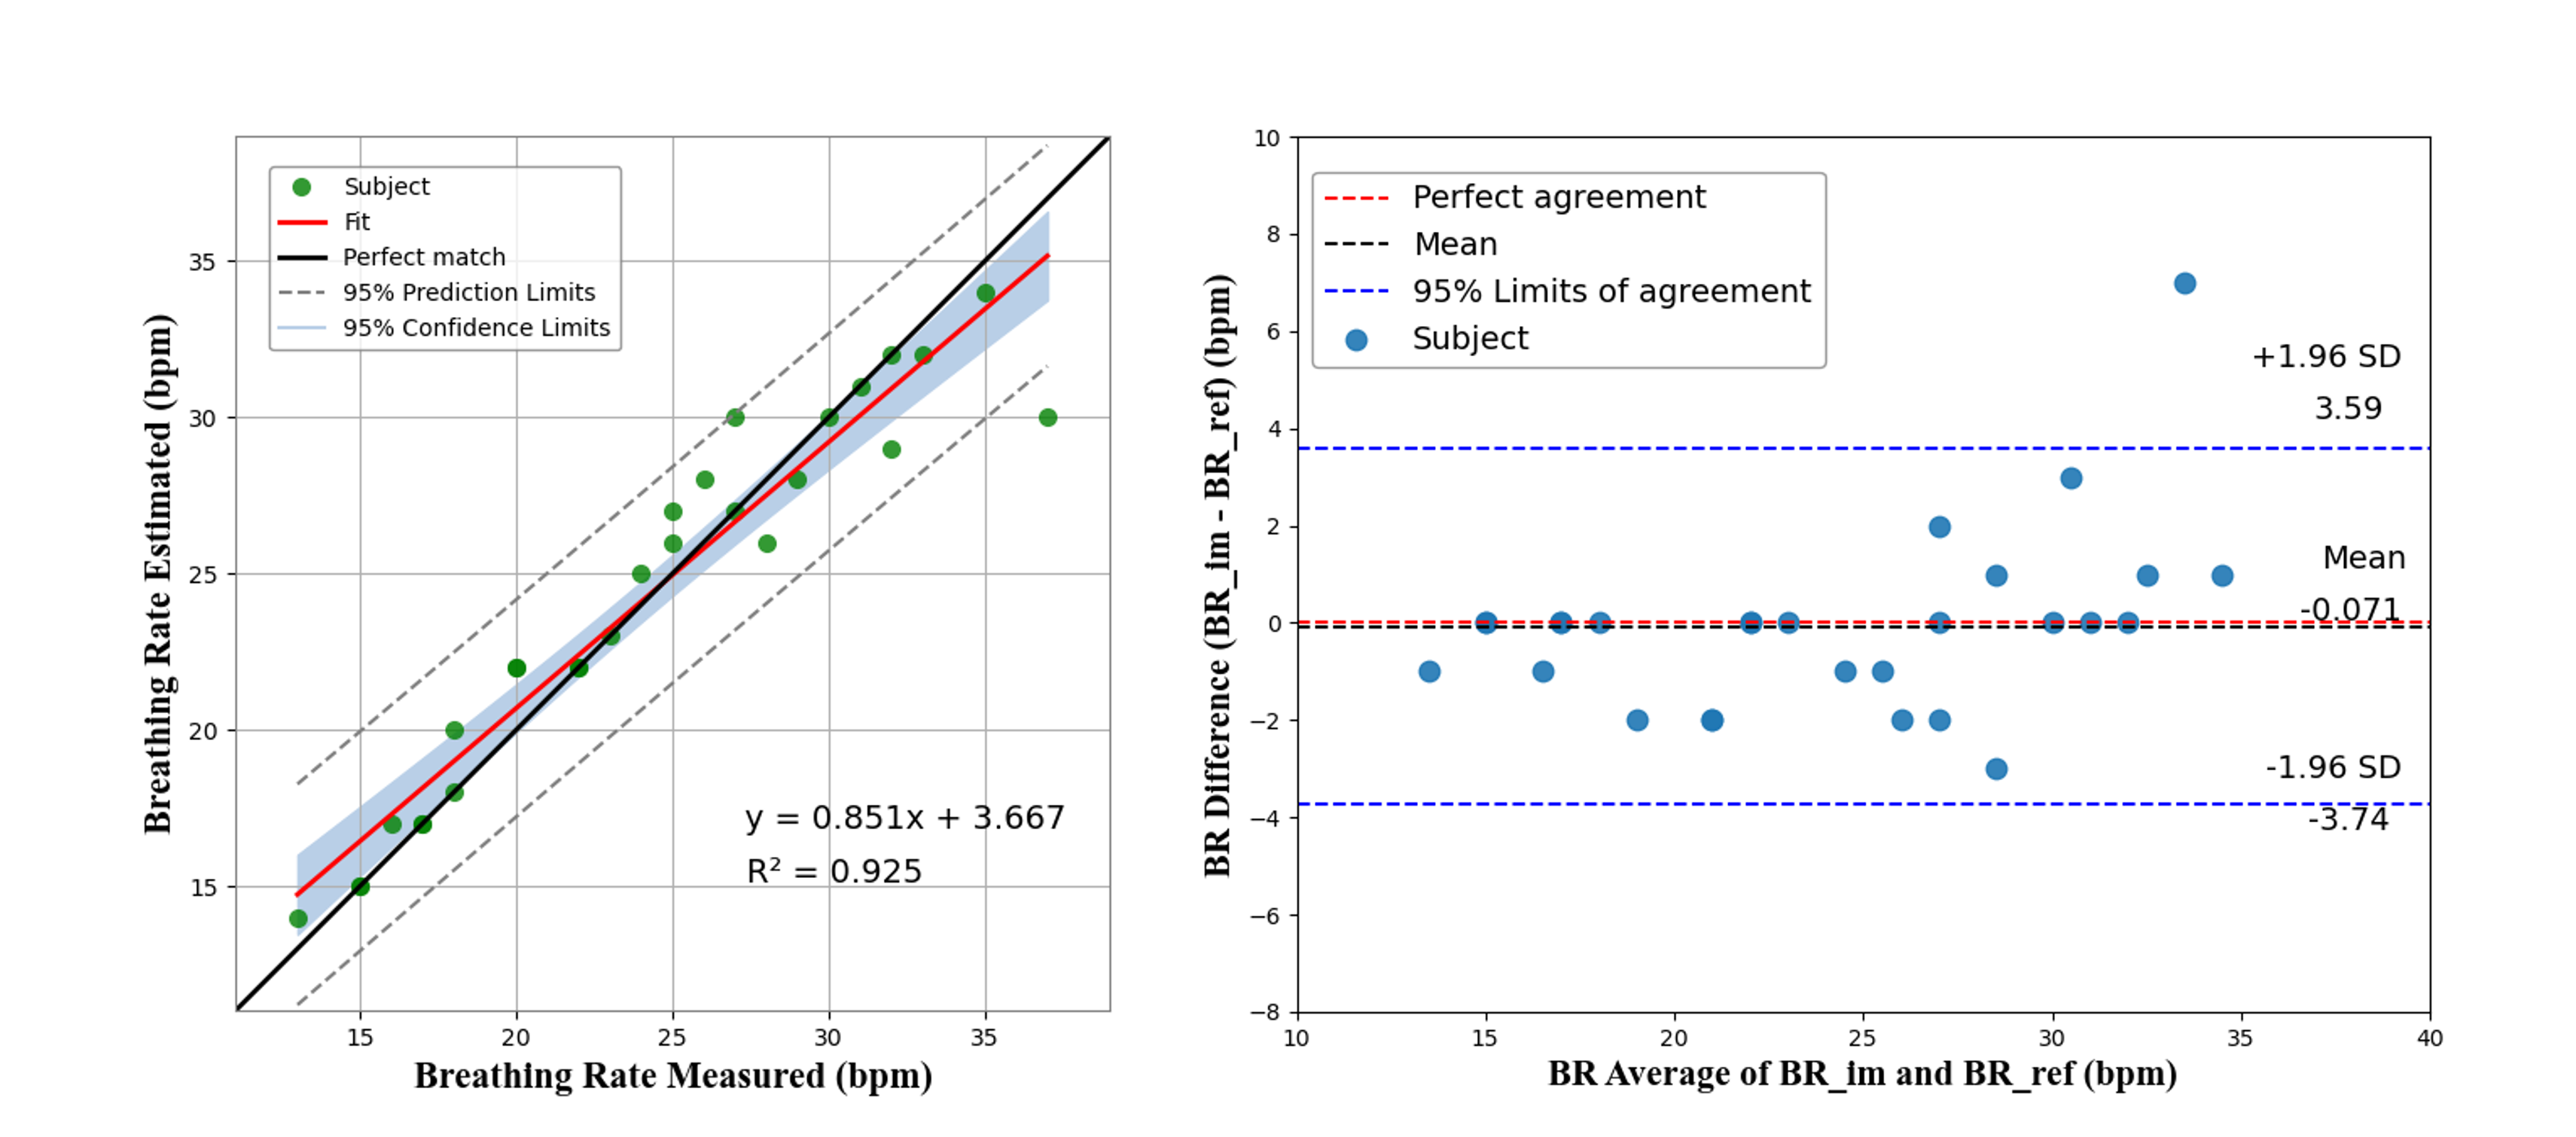
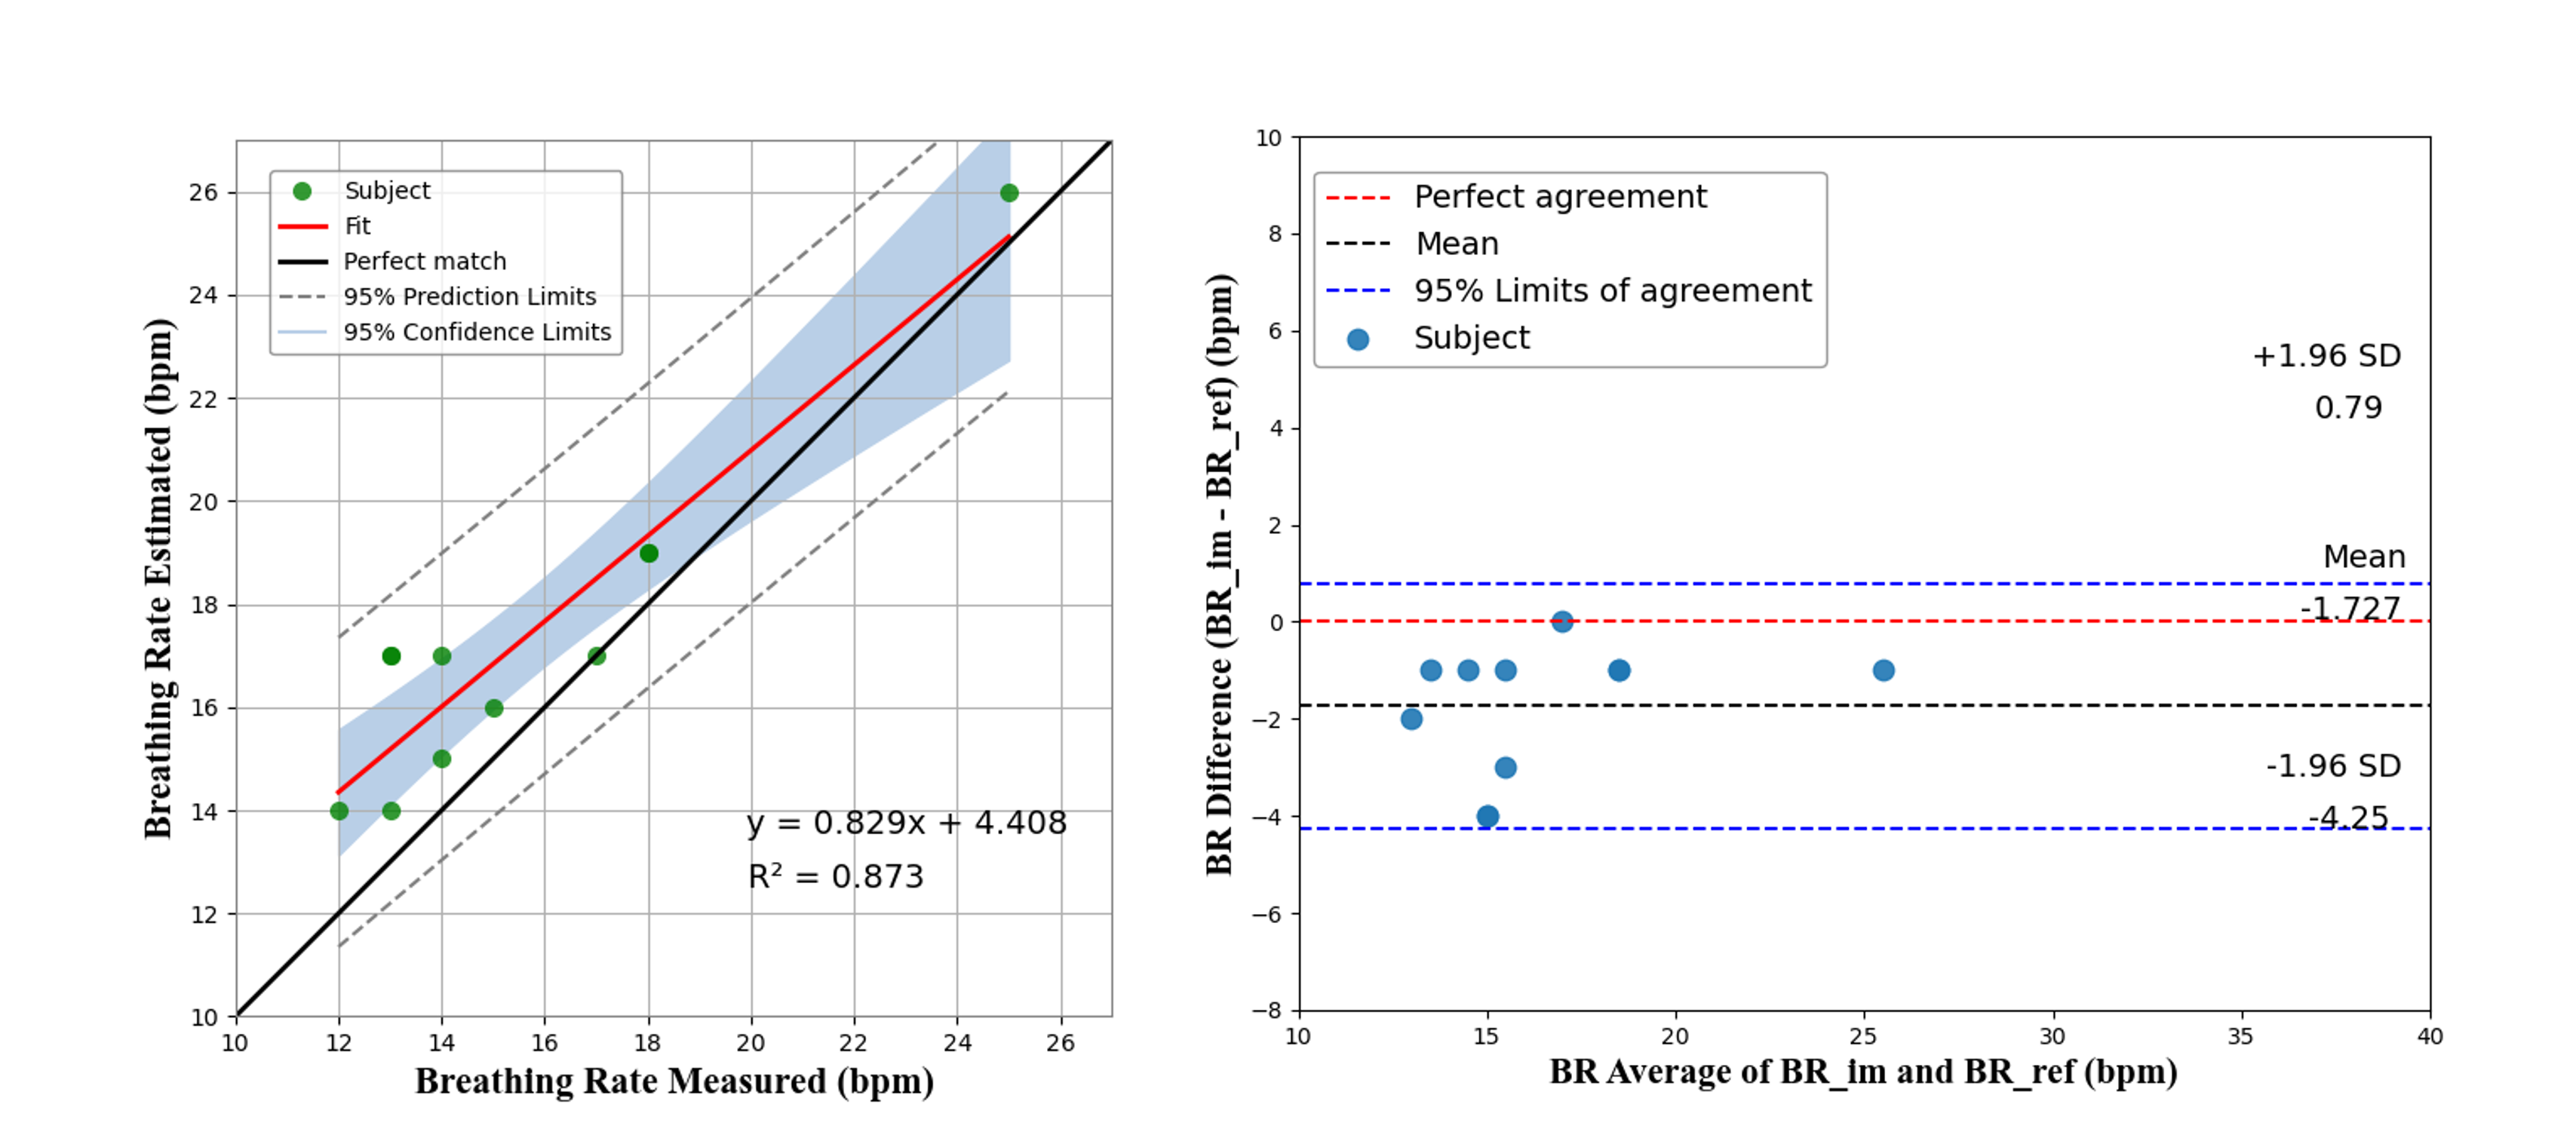
The Figs below illustrates the scatter plot of the breathing rate measured and estimated using the proposed approach and validated using Dataset #1 and Dataset #2. The perfect match line indicates a linear correlation. Almost all scatter points are located between the upper and lower 95% confidence intervals, and most of them are close to the perfect match (black) line with slope equals to 1.
The closer the coefficient of determination (R2) to 1, the better the linear correlation results. I reach a R2 of 0.925 for Dataset #1 and R2 of 0873 for Dataset #2, which indicates that the distribution of the estimated values does not have many substantial outliers. The results also imply that the use of the NIR video allows to detect and measure the breathing rate with great confidence. The Figs also shows the Bland-Altman plot used to analyze the agreement between two different measurement methods, as well as to identify any systematic difference between the measured and the estimated values. For the Dataset #1 It shows the mean difference in BR measurement being -0.071 bpm, and the limits of agreement being -3.74 and 3.59 bpm. Most of the points are within the 95% limits of agreement, indicating that the measured BR is in good agreement with the reference. Only one point (indicated by blue color) is out of the upper limit, for the BR that was measured as 37 bpm, and estimated as 30 bpm. This is because that specific subject had both hands in front of the ROI, and the significant hand motion during the experiment had influenced the results. For the Dataset #2 the mean difference in the BR measurement is -1.727 bpm, and the limits of agreement are between -4.25 and 0.79 bpm. All the points are within the 95% limits of agreement, indicating that the measured BR is in good agreement with the reference.
In summary (Table I), for Dataset #1, an average accuracy of 99.70% was reached, and a mean absolute error (MAE) of 1.14 bpm was assessed via breath-by-breath monitoring. For Dataset#2, even with the covered body and face down, the system demonstrated good performances with the average accuracy of 88.95% and the average MAE of 1.72 bpm. To identify any uncertainty around the mean measurement estimate, I use SE that provides a confidence interval. I calculated the 95% confidence interval as 1.96 x SE. The computed confidence interval is 0.69 bpm for Dataset #1 and 0.76 bpm for Dataset #2, respectively.
| Source | Acc (%) | MAE (bpm) | 1.96xSE (bpm) |
|---|---|---|---|
| Dataset #1 | 99.70 | 1.14 | 0.69 |
| Dataset #2 | 88.95 | 1.72 | 0.76 |
Conclusion and Future Works
Although respiratory cessation was not tested in this study, it is possible to detect such event. From the algorithmic point of view, this cessation would manifest itself as signals with small amplitude. Since the proposed approach can identify outliers (very high and/or shallow peaks), it is possible to detect pauses in breathing. Knowing the time of the cessation event, it is possible to classify a cessation due to apnea, which lasts for about 10 seconds long, or a more prolonged cessation that may indicate a medical emergency.
It is noteworthy that the method can also be applied to multiple people since the OpenPose algorithm detects multiple people in the image. Further research needs to test this approach for viability in case of simultaneous monitoring of more than one subject.
The directions for future studies are as follows. When the subject lies face down, I identify lesser breathing amplitudes, likely due to the respiratory movement being more prevalent in the chest region; the chest of the face-down subject is pressed against the mattress, and this, therefore, cushions the movement. When the test was performed on the floor (without a mattress), better results were achieved. I also noticed that the ROI tracking by Lucas-Kanade optical flow method has its best performance whether there is some texture in that region.
Note: This is a short sample of the published paper on 2020 IEEE SMC Conference.