Abstract: This project demonstrates the usability of thermal video for facial mask detection and breathing rate measurement. Due to the lack of available thermal masked face images, I developed a synthetic dataset based on the SpeakingFaces dataset, by generating masks for the unmasked thermal images of faces.
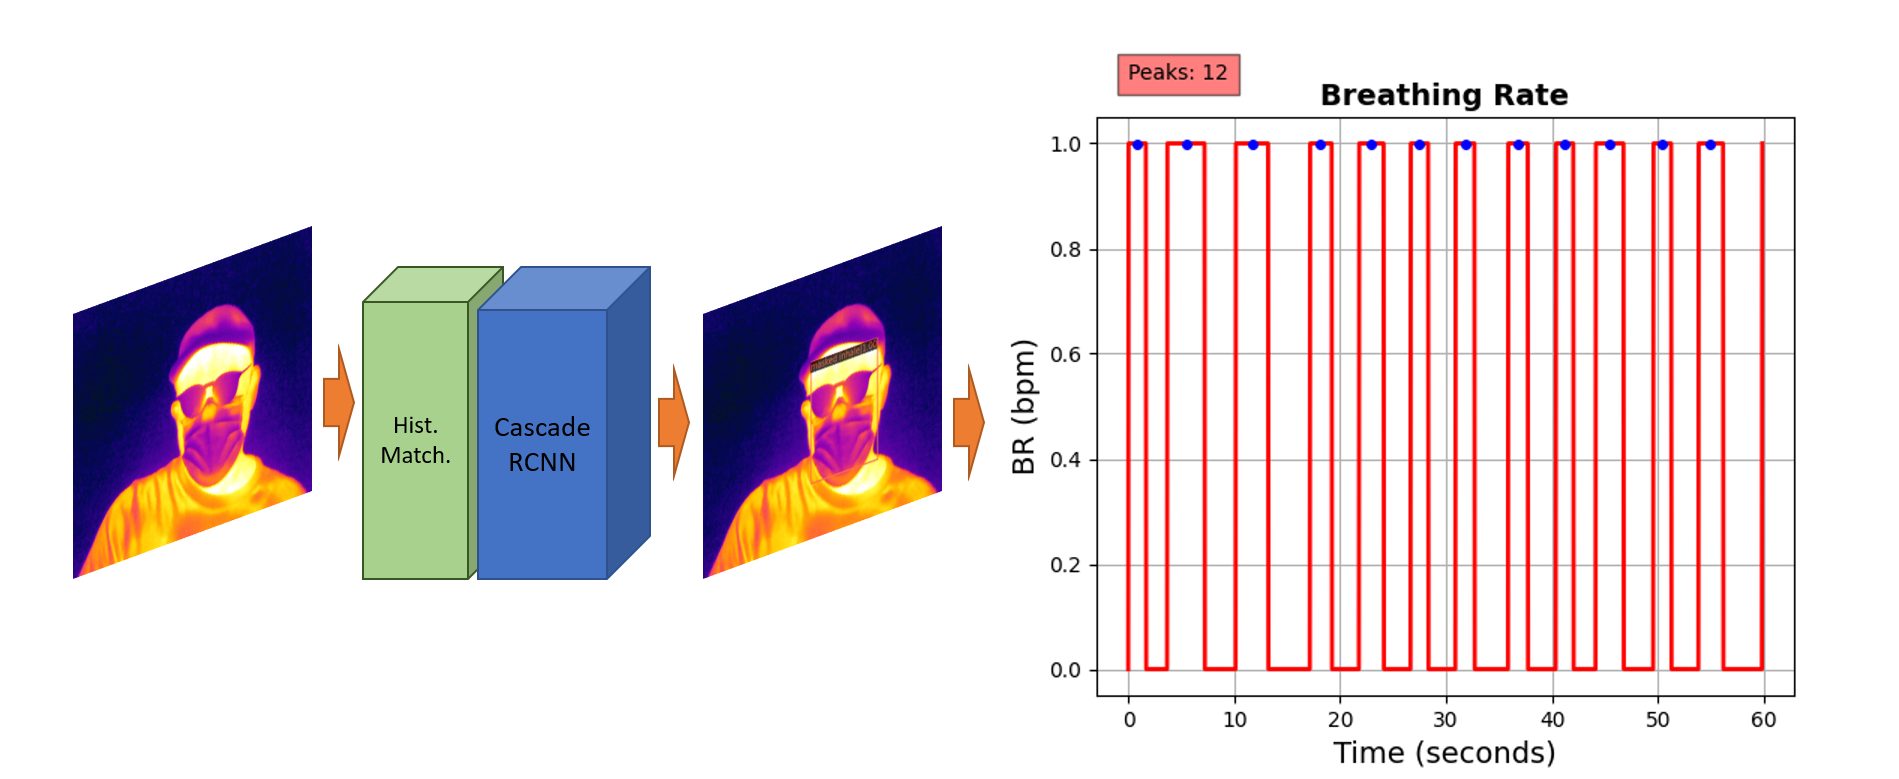
I utilize the Cascade R-CNN as the thermal facial mask detector, identifying masked and unmasked faces, and whether the mask color indicates a inhale or exhale state. With that information I calculated the breathing rate. The proposed Cascade R-CNN is a multi-stage object detection architecture composed of detectors trained with increasing Intersection-of-Unions thresholds.
In our experiments on the Thermal-Mask dataset, the Cascade R-CNN achieves 99.7% in precision, on average, for the masked face detection, and 91.1% for recall. To validate our approach, I also recorded a small set of videos with masked faces to measure the breathing rate. The accuracy result of 91.95% showed a promising advance in identifying possible breath abnormalities using thermal videos, which may be useful in screening subject for COVID-19 symptoms.
Dataset : I used the SpeakingFaces dataset. The SpeakingFaces consists of aligned high-resolution thermal and visual spectra image streams of fully-framed faces synchronized with audio recordings of each subject speaking 100 imperative phrases. Data were collected from 142 subjects, yielding over 13,000 instances of synchronized data (3.8 TB) and it is referred to in the paper: Abdrakhmanova, Madina, Kuzdeuov, Askat, and et al. SpeakingFaces: A Large-Scale Multimodal Dataset of Voice Commands with Visual and Thermal Video Streams.
Key Takeaways:
-
Infrared (Thermal) spectrum.
-
Video-based breathing rate measurement
-
RetinaFace and HRNet for face detection and face landmarks.
-
Object detection with Cascade R-CNN
Final Results
Before reading the whole text, please check the video below showing the final results of this project.
Introduction
This project proposes to apply deep learning techniques to thermal videos in order to assess whether the subjects are wearing masks, as well as estimate the respiration rate by analyzing the thermal image intensity rate over time.
This work’s contributions are as follows:
- I propose a synthetic dataset based on the SpeakingFaces dataset. To the best of our knowledge, this is the first effort to develop a dataset that have thermal images of subjects wearing protective masks. I developed an algorithm that automatically applies protective surgical masks to the faces, thus creating a Thermal-Mask dataset with both masked and unmasked faces.
- I apply the Cascade R-CNN deep learning model to detect whether individuals are wearing masks. For those with masks, I also identify the state of breathing as either inhaling or exhaling.
- Based on the output of the previous step that detects the breathing state, I calculate the breathing rate.
Dataset Description
Given the lack of available datasets with masked face images in the infrared spectrum (thermal images), I consider an enhancement of the existing dataset called SpeakingFaces, by applying an algorithm to add protective masks taking into account the thermal pattern they create.
SpeakingFaces-Dataset
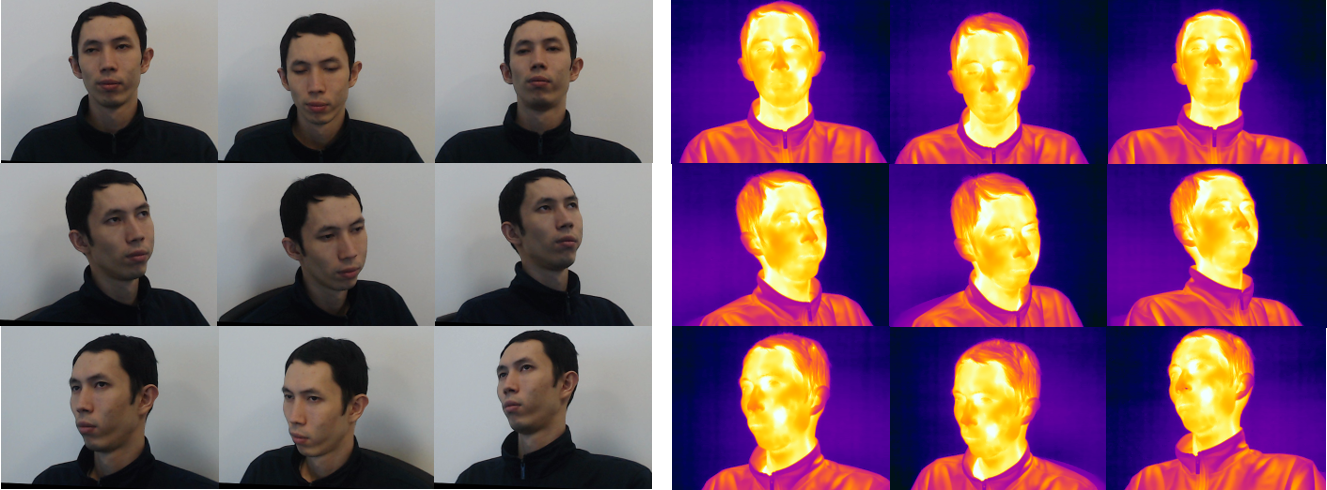
The SpeakingFaces dataset is a large-scale multimodal dataset that combines thermal, visual, and audio data streams. It include data from 142 subjects. The video and still images were collected in both visual and infrared spectra. For each of the 142 subjects, 900 frames of 9 different positions of the head were acquired at each of 2 trials. Figure below exemplifies one subject in the 9 different positions in visual and thermal spectra.
Thermal-Mask Dataset
Applying the RetinaFace and HRNet models, I detected the faces and the facial landmarks on the thermal images. I took images of one subject in a surgical mask using the thermal camera Flir A700. The subject simulated 9 head positions, in both the inhalation and exhalation respiratory mode. Next, I segmented and cropped out the masks to overlay them onto the original data set images as seen in the figure below.
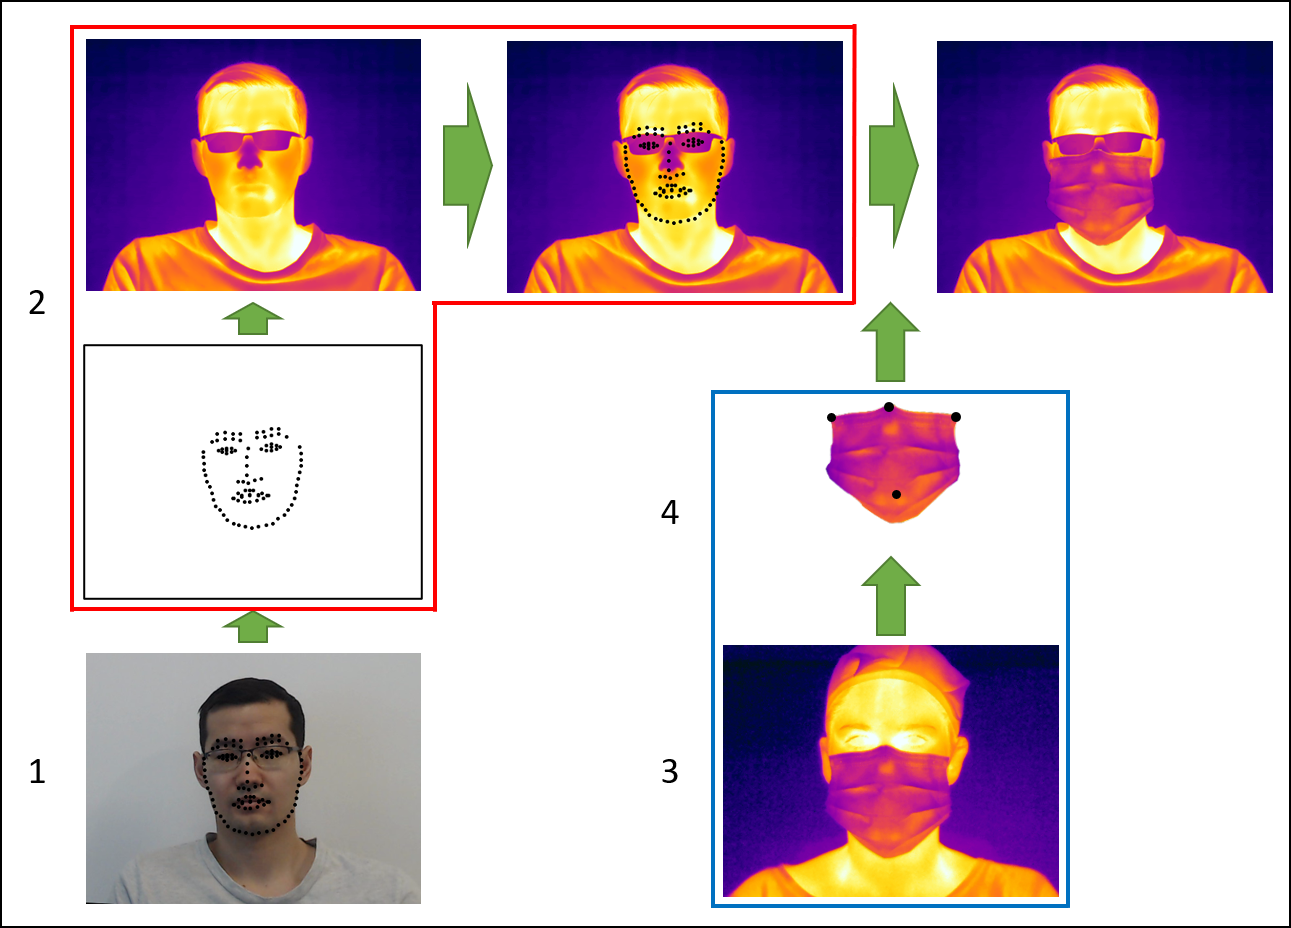
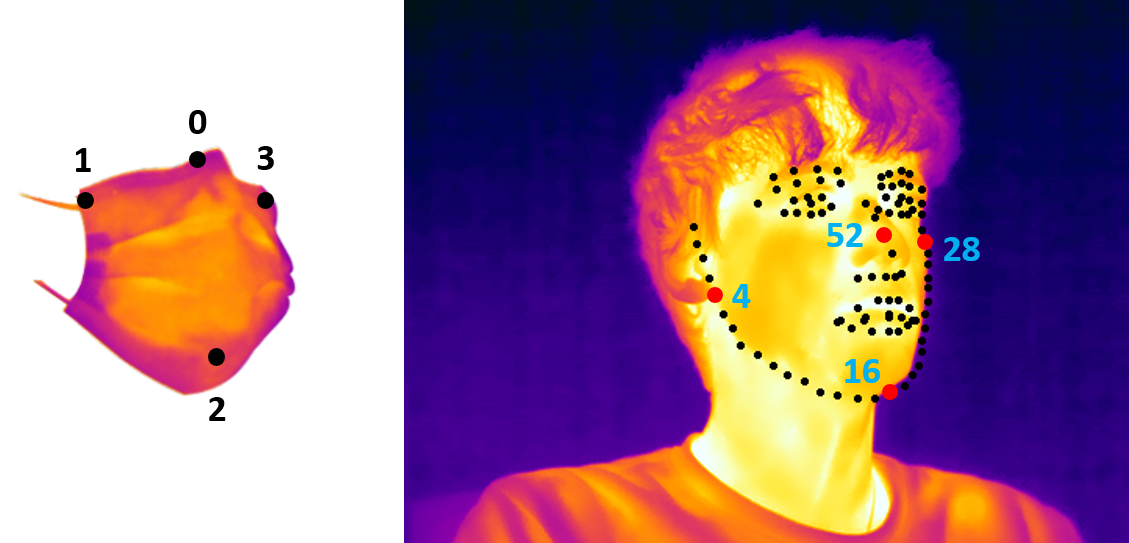
Figure below presents the landmarks used to match the facial masks and the thermal faces. To adjust the facial masks to each face, we performed the following image transformations: Translation, Resizing and Rotation.

Among the 142 subjects, we selected 80 to be masked and 62 to be unmasked, and created a total of 42,460 thermal masked faces and 33,448 thermal unmasked faces.
Proposed Approach
In this section, we discuss how the dataset created was organized. We also describe the model used for mask detection with the respective breathing status. Finally, we cover the breathing rate measurement based on the mask colour variation.
Dataset Preparation
With 42,460 faces with masks (80 subjects) and 33,448 faces without masks (62 subjects), we joined the samples, and among the 142 subjects, we randomly selected the samples as 70% for training (100 subjects), 20% (28 subjects) for validation and 10% (14 subjects) for testing. Those percentages will not be precise among the total number of images because the subjects do not have the same number of images since we have deleted the bad ones. The distribution ended up been 69.86% for training, 19.55% for validation and 10.59% for testing. Those samples will be applied to the Cascade R-CNN model for object detection. Table below summarizes the total number of samples in the final subset of the Thermal-Mask dataset.
| Set | Unmasked Faces | Masked Faces | Subjects |
|---|---|---|---|
| Train (69.86%) | 23,188 | 29,842 | 100 |
| Validation (19.55%) | 5,940 | 8,905 | 28 |
| Test (10.59%) | 4,320 | 3,713 | 14 |
| Total (100%) | 33,448 (44.06%) | 42,460 (55.94%) | 142 |
The dataset has been labelled to three classes:
- unmasked face
- masked exhaling face
- masked inhaling face
Mask Detection
To create our masked/unmasked face detection architecture, we used the MMDetection, a PyTorch-based object detection toolbox that, besides training and inference codes, also provides weights for more than 200 network models for object detection and instance segmentation.
Following the model representation of the MMDetection, we divided our model architecture into the following parts: Backbone, Neck and Head.
The backbone refers to a convolutional neural network (CNN), which takes as input the image and extracts the feature map. In our approach, we applied the ResNet and the ResNext backbones. In our architecture, we applied the ResNet-50 and Resnet-101 with 50 and 101 layers, respectively. With the ResNext backbone, we applied two versions, the ResNeXt-101-32x4d, which stands for the architecture with 101 layers, 32 parallel pathways and a bottleneck width of 4 dimensions. The second version is the ResNeXt-101-64x4d that differentiates only due to its higher cardinality being equals to 64. Adding groups in parallel improve performance with the same computational complexity. All the backbones were previously trained on the ImageNet dataset.
The Neck is an intermediate component between a backbone and the heads. The long sequence of the CNN layers leads to increase of the semantic value of feature maps, while the spatial dimension (resolution) decreases. To overcome the low resolution of the feature maps in upper layers and create a more generalized model, we applied the as the neck the _Feature Pyramid Network (FPN). The FPN takes an image as an input and outputs feature maps at multiple levels of size in a fully convolutional fashion.
After we process the image by a backbone (CNN) with the Feature Pyramid Network (FPN), we apply as the head, the Cascade R-CNN object detector. Commonly the detector models are trained with a single threshold for Intersection over Union (IoU), being at least 50% for the object to define positives and negatives examples. It is quite a low threshold that creates many bad proposals from the Region Proposal Network (RPN), and it is difficult to reject close false positives to detect various quality and size objects in an image accurately. Detection performance also degrades for larger thresholds.
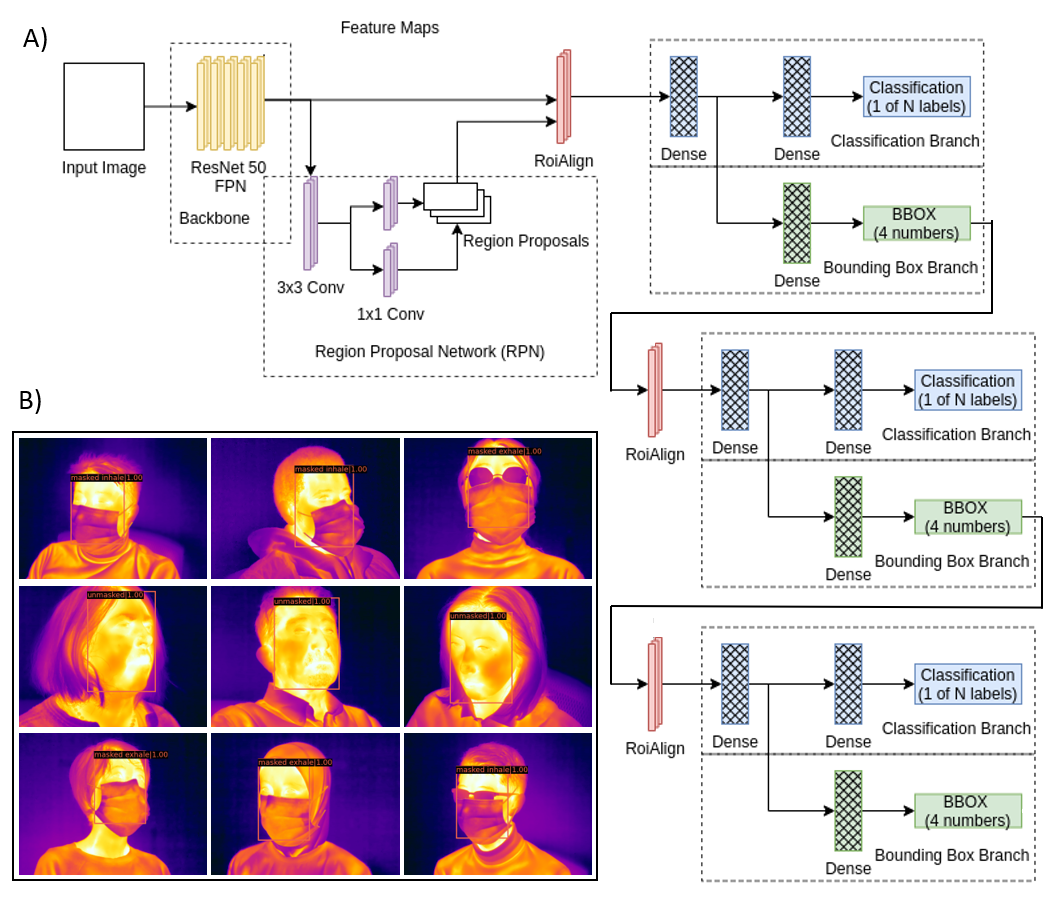
To overcome this problem, the Cascade R-CNN, a multi-stage object detection architecture, creates detectors trained with increasing IoU thresholds. For our application we applied IoU = (0.5, 0.6 and 0.7). It uses the same architecture as Faster R-CNN but with more branches in a sequence.
The figure below show the architecture for cascade R-CNN and the results applied to the test set.
Breathing Rate Measurement
Our ultimate goal is to measure the breathing rate of masked people in the COVID-19 context. We created a small dataset to validate the breathing rate measurement application based on the intensity, or mask’s colour variation. Using the thermal camera Flir A700, at a distance of 1.5m, we collected thermal videos from 11 masked subjects. Each subject is recorded three times for 1 minute each. In the first video, we ask them to breathe slowly; in the second video, we ask for faster breathing, and in the last recording, we ask for normal breathing. In total, we collected 33 videos from all 11 subjects. With that, we were able to apply the model previously described and measure each one’s breathing rate.
Figure below presents one example of a subject “slowly” breathing with 12 breaths per minute (BPM). Considering that each individual has a different breathing pattern and the videos were taken in various locations with different thermal distributions, we had to standardize each frame’s pixel intensity distribution. For this, we applied histogram matching, where we chose an image from the Thermal-Mask dataset as the reference and matched each frame histogram using the histogram matching function available on the scikit-image library. In sequence, we applied the frames to the Cascade R-CNN mask detection model to detect faces and classify them between unmasked, masked exhaling (level 1) and masked inhaling (level 0) subjects.
Results and Discussion
To evaluate how the Cascade R-CNN performs on the mask detection task, we used the mean Average Precision (AP) and the mean Average Recall (AR) metrics.
This measure is related to the Intersection over Union (IoU) that measures the overlap between the ground truth box and the predicted box over their union. Predicted bounding boxes with IoU above a chosen threshold are classified as True Positive (TP). Bounding boxes with an IoU below the threshold are classified as False Positive (FP), and when there is an object but not a predicted box, we classify it as False Negative (FN). True Negative (TN) is not applied since the model would identify multiple empty boxes as non-object.
Precision represents a ratio of the true positive cases of the masked/unmasked face detection and the total number of positives, both true and false ones:
\[\begin{equation} \begin{split} Precision & = \frac{TP}{TP + FP} = \frac{true\ object\ detection}{all\ detected\ boxes} \end{split} \end{equation}\]Recall stands for a ratio of the true positive cases of the masked/unmasked face detection and the number of ground truth cases, including both true positives and the missed true cases called false negatives:
\[\begin{equation} \begin{split} Recall & = \frac{TP}{TP + FN} = \frac{true\ object\ detection}{all\ ground\ truth\ boxes } \\[3pt] \end{split} \end{equation}\]The metric that summarizes both recall and precision for all classes and provides an assessment of the entire model is the Average Precision (AP). It is calculated for each category as the area under the curve (AUC) of precision-recall curve. The AP computes the average value of precision over the interval from Recall = 0 to Recall = 1 of Precision = p(r).
The AP tells us how well we are doing overall in terms of each category (class). To compute it over all three classes (unmasked, masked exhaling and masked inhaling), we calculate the average of AP with each class, calling it as mean Average Precision (mAP).
\[\begin{equation} \label{eq4} \begin{split} mAP & = \frac{1}{N}\sum_{i=1}^{N} \int_{0}^{1} p_i(r_i)dr \\[3pt] \end{split} \end{equation}\]We applied the MS-COCO averaging approach, that calculates the mAP over different IoU thresholds (0.5 :0.05: 0.95).
Rather than computing recall at a fixed IoU, we also calculated the AR at IoU thresholds varying from 0.5 to 1. Average recall describes the area under the Recall x IoU curve. The Recall x IoU curve plots the Recall for each IoU threshold value within the interval \(\in [0.5,1.0]\), and is calculated as follows:
\[\begin{equation} \label{eq5} \begin{split} AR & = 2 \int_{0.5}^{1} recall(IoU) \text{d}IoU \\[3pt] \end{split} \end{equation}\]Similarly to the average precision (AP) metric for the class-specific object detection, AR summarizes the performances across IoU thresholds (for a given number of proposals) and also correlates well with the detection performance.
Table below presents the results of AP, AP50, AP75 and AR for each backbone applied to the Cascade R-CNN. We reached the best result with the ResNeXt backbone, applying 101 layers, 64 parallel pathways and a bottleneck width of 4 dimensions with the Feature Pyramid Network (FPN) as the neck of our architecture.
| Backbone | AP | AP50 | AP75 | AR |
|---|---|---|---|---|
| ResNet-50-FPN | 0.873 | 0.997 | 0.986 | 0.904 |
| ResNet-101-FPN | 0.873 | 0.997 | 0.990 | 0.905 |
| ResNeXt-101-32x4d-FPN | 0.877 | 0.997 | 0.989 | 0.911 |
| ResNeXt-101-64x4d-FPN | 0.879 | 0.997 | 0.990 | 0.910 |
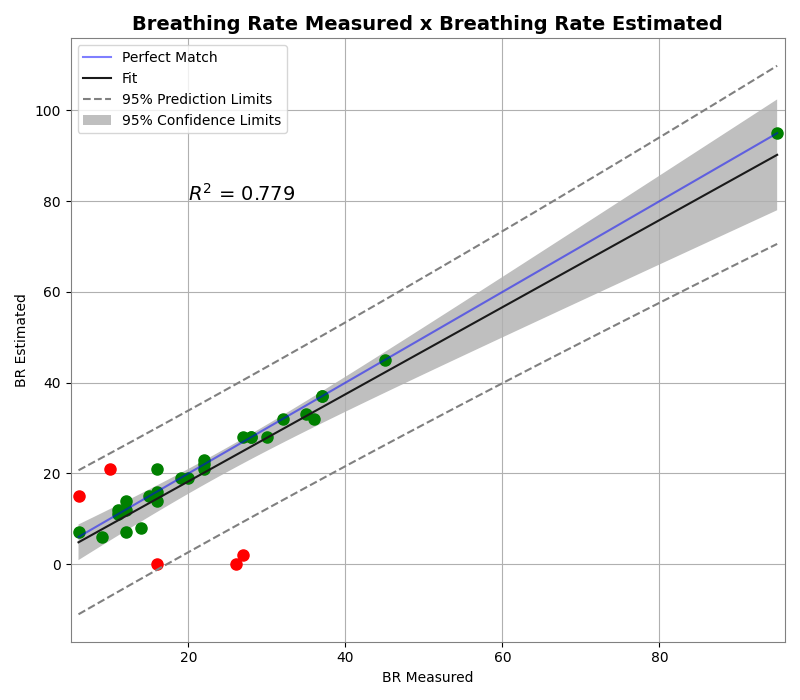
Figure below illustrates the scatter plot of the breathing rate visually measured, and also estimated using the proposed approach. We highlight the breathing rate correctly evaluated using green circles, and the misdetected ones using red circles. The perfect match line (blue) indicates the perfect linear correlation where the breathing rate estimated is equal to the breathing rate measured. We reach an R2 of 0.779, which indicates that the estimated values’ distribution has just a few outliers (red circles). After a careful analysis of the images and results, we found that the subjects, whose respiratory rate is outside the confidence interval range, are wearing masks of inadequate size. This might cause the airflow from the respiration to escape through the sides of the mask and not accumulate. Therefore, it will not heat the region between the mask and the face, making it difficult to detect the exhaling state. For the proper use of the created model, the participants must wear masks suitable for their respective face shape and size. This information is also important to affirm that the use of masks will not always provide the necessary protection if the individual does not wear the proper mask size and shape.
Conclusion and Future Works
The overall results indicate that:
-
The developed Thermal-Mask dataset contributes to detecting masked/unmasked faces in the infrared (thermal) spectrum. It can also be the first step towards a more in-depth analysis of the proper use of the masks, assessing the position and the extent to which the region between the mask and the face contains the airflow exhaled by individuals.
-
The Cascade R-CNN model was proved to be a great choice. It has highlighted the fact that the models with multiple branches associated with different IoU can be used in the detection of the protective masks in the infrared spectrum. Increase in the number of these branches will generate increasingly better results.
-
The ultimate goal of our work is to calculate the respiration rate. We were able to verify that for the subjects wearing the appropriate mask, even with continuous head movements in video, we can estimate the respiratory rate with high accuracy. More research is needed to assess whether the breathing difficulties, other than the symptoms of COVID-19, affect this measurement.
As future work, we plan to further expand the Thermal-Mask dataset with many more facial mask options, exploring variations in the protective mask material, types, and subject biometrics and/or demographics. In addition, we plan to create the sets with subjects incorrectly wearing the mask and other occlusions to identify its correct use, and distinguish between occlusions that are not masks.
Considering that the original dataset (SpeakingFaces) and therefore the created one (Thermal-Mask) were obtained in a controlled environment with specific face positions, distance from the camera and having no backgrounds, we found it difficult to generalize our model to the real-world applications. In this direction, the next step is to do experiment using some complex thermal background, as well as different distances between the subjects and the thermal camera.
Note: This is a short sample of the published paper on 2021 IEEE IDT Conference.